

Dataset
Dataset explanations describe the data context behind an Umnai model.
Before induction, the platform analyses the training dataset to extract information that helps guide the induction process and support explanations. This includes feature characteristics, engineered features, histograms, feature groups, anomalies, windows, segments, time-series transformations, dependencies, and constraints.
These concepts help explain not only what the model learned, but also the data it learned from.
Features
Features are the inputs to a model.
The model learns patterns and relationships from features in order to make predictions. Feature quality and relevance have a significant effect on model performance, so feature characteristics and feature relationships are important for understanding a model and its predictions.
Features can be classified by the type of data they contain.
Features can be taken directly from the raw dataset, or they can be modified and combined to create engineered features.
Engineered features
the platformFeature engineering the platform is the process of selecting, creating, and transforming the features used in a model.
Engineered features are created or transformed from existing raw dataset features.
The platform includes built-in functionality for some types of feature engineering.
As with raw features, engineered feature characteristics, relationships, and derivation are important when interpreting and explaining a model and its predictions.
Histograms
the platformHistogramsthe platform show the frequency distribution of dataset values.
A feature histogram visualises the shape and spread of a feature. It can reveal patterns, anomalies, data coverage issues, and outliers.
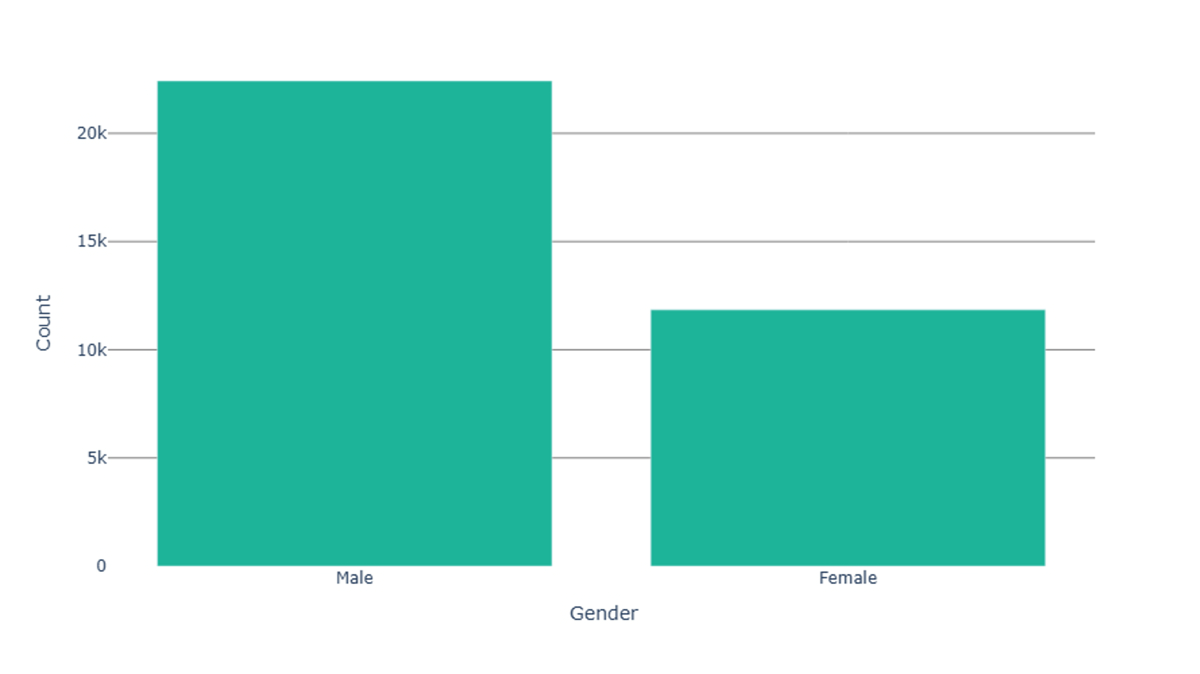
In the Gender histogram, the count of female examples is much lower than the count of male examples. This indicates that the female category may be under-represented in the dataset, which could lead to inaccuracy or bias in a model trained on that data.
Feature groups
Feature groups combine related continuous features inside the ESM.
For example, Latitude and Longitude can be combined into a feature group called Location.
The model still retains the individual features as inputs. Inside the model, however, they are treated as a feature group. The model has a module for the feature group, and interactions are expressed with the feature group rather than only with each individual feature.
As a result, explanations can also be expressed in terms of the feature group. For example, module attributions can be returned for Location.
Anomalies
the platformAnomaliesthe platform, also known as outliers, are data points that deviate significantly from the norm or expected pattern of the data.
Some anomalies indicate data issues, such as human errors during data entry. Others may represent unusual, rare, or potentially interesting events. In both cases, anomalies can be important for understanding and explaining data and models.
When a dataset is onboarded, the platform automatically checks for anomalies. These anomalies are flagged for optional human review before induction begins. A reviewer can act on the anomaly, leave it flagged, or deliberately ignore the flag.
During induction, anomalies that have not been deliberately ignored are stored as part of the ESM. This allows the ESM to flag explanations and results that may rely on anomalous data, so teams can decide whether follow-up action is needed.
Windowing
the platformWindowingthe platform is a type of feature engineering that aggregates feature information across a window.
Windowing applies to features that have some form of sequence, typically time-series data or transactional data. In time-series data, time acts as the sequence index. In transactional data, a sequence index may be something like a transaction number.
For example, when monitoring payment transactions for fraud, an engineered feature may count the number of declined transactions per merchant over the past day.
Windowing information is needed when explaining models and predictions because it clarifies the meaning of engineered features built from sequential or temporal data.
Segments
A the platformsegmentthe platform is a subset of data that shares certain characteristics and is distinct from other subsets in the larger dataset.
Examples include:
Segmentation divides data into meaningful and actionable parts. It supports more precise analysis, targeted interventions, and better decision-making.
Segments are useful for:
During induction, the platform automatically segments the training data into regions that behave similarly. These segments are reflected in, and accessible from, the conditional_expression of each rule in the model.
This segmentation information can be compared and contrasted with business knowledge to build confidence in the model and dataset, identify issues, and inform or update business knowledge.
Time-series transformations
the platformTime-series datathe platform is a sequence of data points collected at successive points in time, usually at uniform intervals.
It is characterised by trends, seasonality, stationarity, and noise. These properties are important for understanding temporal patterns and making predictions.
To use time-series data effectively, the platform provides transformation functions that can engineer features from temporal information in different forms. Examples include Fourier transforms, phase space transformations, and auto-regression.
When explaining models and predictions, temporal information is needed to interpret time-based or sequence-based data correctly.
Dependencies
the platformDependenciesthe platform are relationships between features and feature interactions that give structure to predictions and explanations.
Relationships created through feature engineering are one example of dependencies.
Dependencies help ensure that predictions and explanations are lossless and traceable from the input to the prediction and its explanation.
Dependencies are complementary to constraints.
Constraints
the platformConstraintsthe platform are known restrictions on the data or model, derived from human knowledge, world models, and cause-and-effect information.
For example, a constraint may filter out an implausible combination such as "pregnant man".
Constraints provide a link to world models and add plausibility and cause-and-effect checks to the modelling and explanation process.
Constraints are complementary to dependencies.