

Module dependency plot
A Module Dependency Plot, or MDP, visualises the behaviour of a module in an Umnai model.
It shows how the attribution from a module changes as the module’s input values change. Because modules represent individual features or feature interactions, an MDP helps explain model behaviour in terms of those features and interactions.
What an MDP shows
An MDP visualises the rules inside a module.
Each rule describes a region of behaviour for that module. The MDP shows how the module attribution changes across those regions, making it easier to see what the model has learned about a feature or feature interaction.
This helps answer questions such as:
MDPs compared with PDPs
MDPs are similar in purpose to Partial Dependency Plots, or PDPs.
Both help explain how model output changes with respect to model inputs. The difference is that MDPs are generated directly by a Hybrid Intelligence model.
PDPs usually rely on sampling and aggregation. MDPs are produced from the model’s module structure, so they can provide a more direct reflection of what the model has learned about the behaviour of the feature or feature interaction represented by the module.
Continuous feature modules
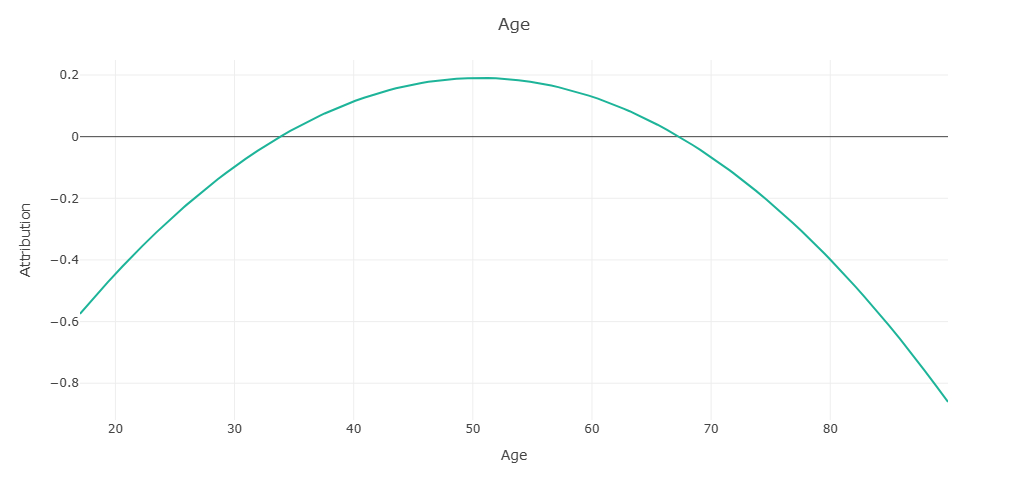
For a continuous feature module, the MDP shows how module attribution changes across the feature’s value range.
Categorical feature modules
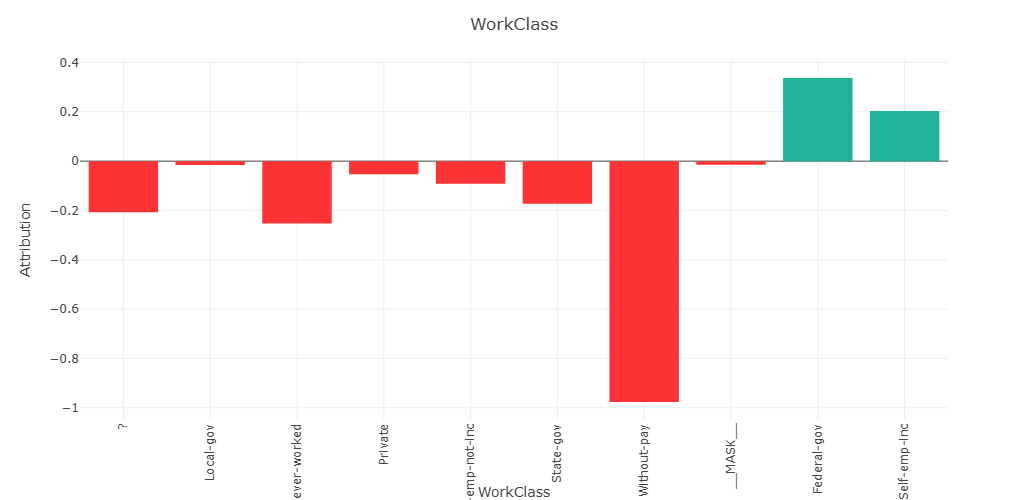
For a categorical feature module, the MDP shows attribution values across categories.
Interaction modules
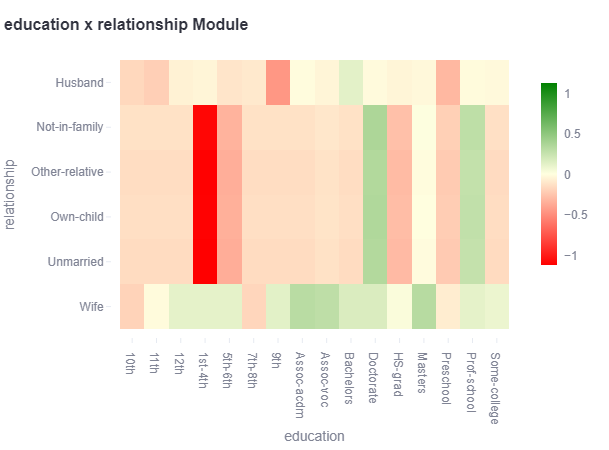
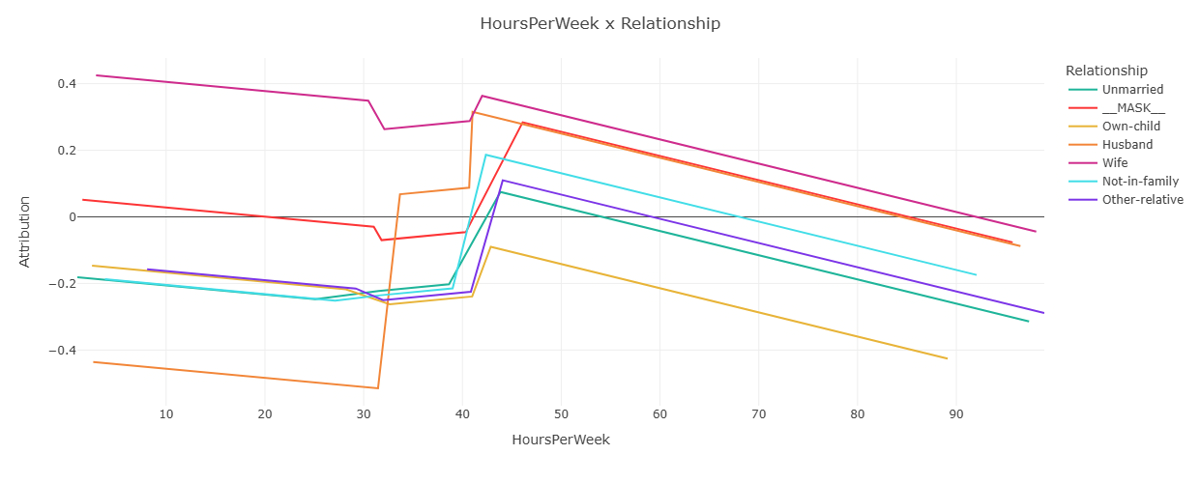
For an interaction module, the MDP shows how attribution changes across combinations of input features.
This can include interactions between two categorical features, or interactions between continuous and categorical features.
Related concepts
Module and feature importance explains how modules and features are ranked by global contribution.
Explainable Neural Net (XNN) explains modules, rules, attributions, and interactions.
Module dependency view explains how to generate module dependency output through the API.