

Model behaviour
Model behaviour can be inspected through the rules, partitions, modules, and module dependency plots produced by an Umnai model.
A rule is a symbolic representation of the model’s behaviour for a specific segment of the problem space. Together, the rules from each partition of each module describe the model’s behaviour for features and feature interactions.
In this sense, the overall behaviour of the model is described by all of the rules in all of the modules. A model can be expressed as a symbolic program made up of its rules, although that would usually be inefficient to execute directly.
Identifying trends and changes in behaviour
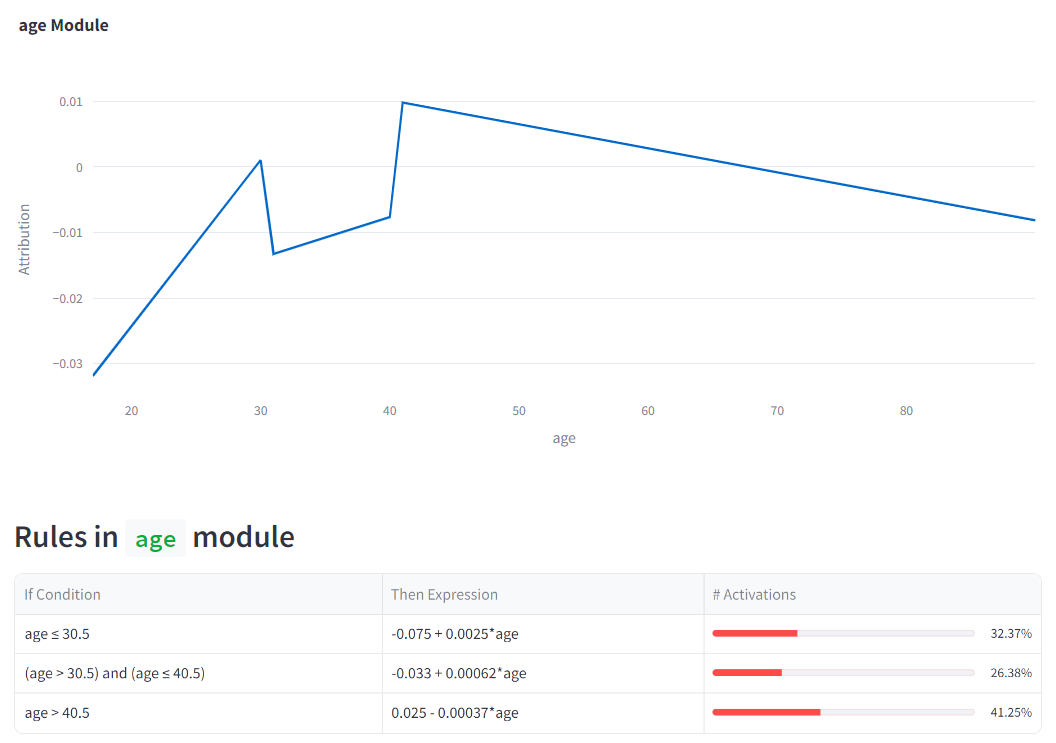
Module dependency plots, or MDPs, visualise the rules in a module.
Inspecting the MDP for a module can show whether induction discovered trends, peaks, troughs, or abrupt changes in behaviour for the feature or interaction represented by that module.
For example, an Age module MDP might show that Age has a negative influence until age 23, becomes positive at that point, increases steadily until age 55, and then remains relatively constant with a slow decline.
These trends and points of change can become useful model insights. They may guide business strategy or support decision workflows.
For example, if the Age module is part of a loan approval model and a 55-year-old customer has just been declined, a customer service agent may be able to explain that the customer’s chances of approval are likely to decrease in the future unless another factor improves. The agent may also be able to point to a relevant factor, such as Education, if that insight appears in the Education module MDP.
Using rules for precision
MDPs are useful for visual inspection. Rules provide a more programmatic way to inspect precise model behaviour.
A visual inspection of the Age MDP might show that the influence of Age increases between 30 and 40. Inspecting the activated rule can provide the exact range and expression.
For example:
This lets teams move from visual trends to precise rule-level behaviour.
Conformance to expected behaviour
Because MDPs show precise model behaviour, they can be compared with business and application knowledge.
When model behaviour conforms with expectations, trust in both the model and the human understanding of the domain is reinforced.
When model behaviour does not conform with expectations, there are usually two broad possibilities.
For example, business knowledge may suggest that Age should begin having a positive influence from age 18, but the model’s MDP may show that the positive influence begins from age 23.
If the dataset contains very few samples between ages 18 and 23, the MDP can be used together with histograms to identify that more data should be collected in that region.
If the dataset is representative, the model may instead be revealing that the business assumption should be re-examined.
Analysing segment behaviour over time
Some features change predictably over time.
For example, a person’s Age usually increases over time. When a feature behaves this way, MDPs can be used to understand how model behaviour may change as that feature changes.
In a loan approval model used by a bank branch in an area with an ageing population, the Age MDP may show that approval rates are likely to decrease over time. This could lead the bank to target growth in other areas or promote alternative products, such as pension-related products, in that region.