

Evaluate models
Evaluate a running deployment using the appropriate data population. Review the metrics, plots and class counts together when assessing the result.
Before you begin
Confirm that the intended deployment is RUNNING. Decide whether you are inspecting training performance or independent test performance. Test requires observations labelled as test data during ingestion; the training/validation split used during training does not supply that test population.
Keep the deployment and data selection fixed when comparing thresholds. If you compare different models, record which dataset and population each result uses.
Select evaluation inputs
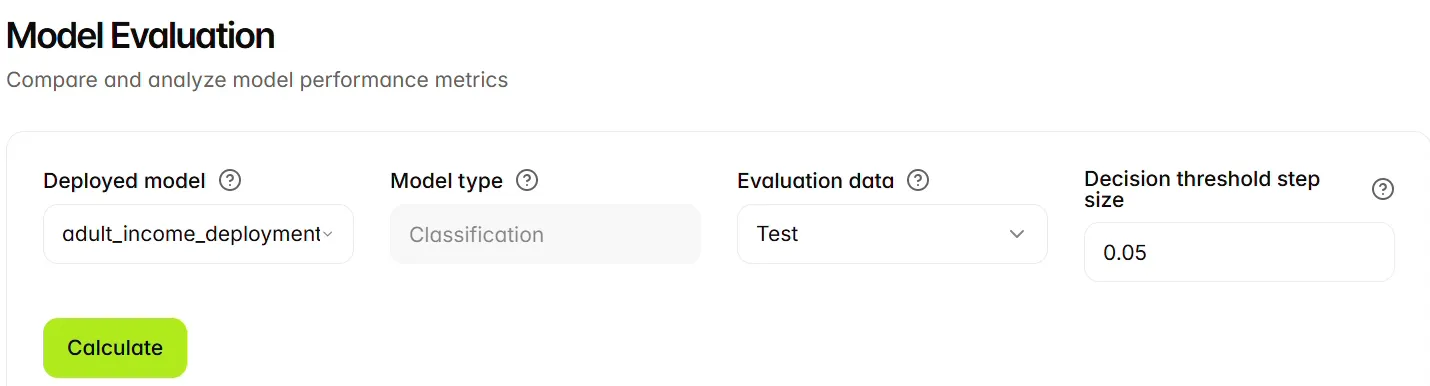
Select the running deployment you want to evaluate. The example uses adult_income_deployment with Test data. A deployed model is the serving resource associated with a trained model; confirm that it is the intended deployment before calculating results.
Evaluate a deployed model
Open Model Lab > Model Evaluation. Evaluation runs against a Deployed model. If your model has not been deployed, create a deployment configuration and deploy the trained model, then return here.
-
Select the intended Deployed model.
-
Check the automatically detected Model type. The example is Classification; regression models use a different set of evaluation metrics.
-
Choose Evaluation data: Test, Train or All. The example uses Test. Test evaluation requires test observations; All includes training data and is not an independent test set.
-
For classification, review Decision threshold step size. The example uses 0.05. This value sets the resolution of the returned threshold results; the UI accepts values from 0.005 to 0.1.
-
Select Calculate and wait for Evaluation complete.
-
For classification, review the decision threshold, metrics, ROC and PR plots, and confusion matrix. For regression, review MAE, MSE, MAPE, R2 Score and Maximum Error.
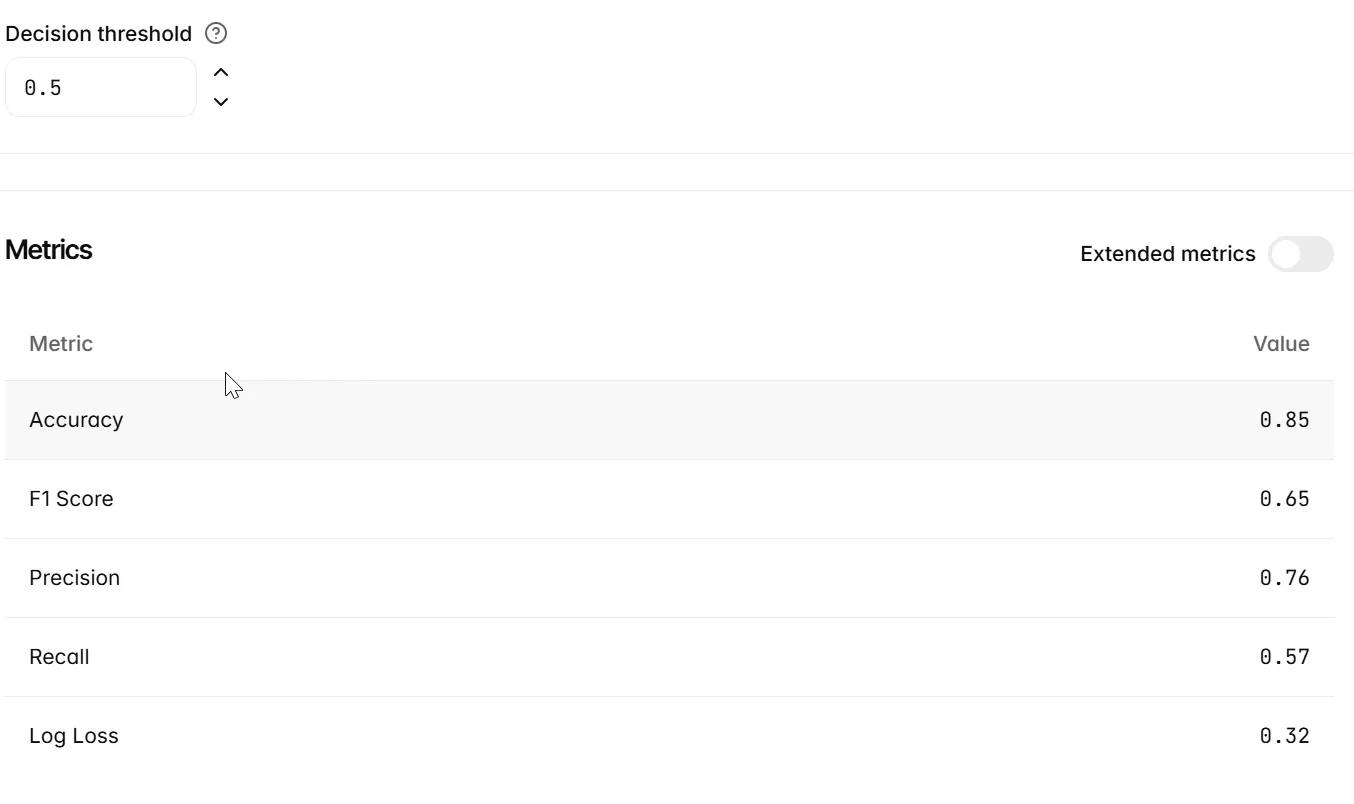
The results below belong to adult_income_deployment, not the payments fraud model inspected earlier. The selected Decision threshold is 0.5. Use this control to compare the returned threshold results and assess the trade-off between false positives and false negatives for your task.
Enable Extended metrics to display additional classification measures. When comparing evaluations, retain the deployment, evaluation data selection, decision threshold and threshold step size so that results can be interpreted on the same basis.
Read the example metrics
After Evaluation complete, review the metrics together. The example below uses decision threshold 0.5 with Extended metrics off. The values describe this evaluation and are not acceptance criteria for other models.
Read evaluation plots and counts
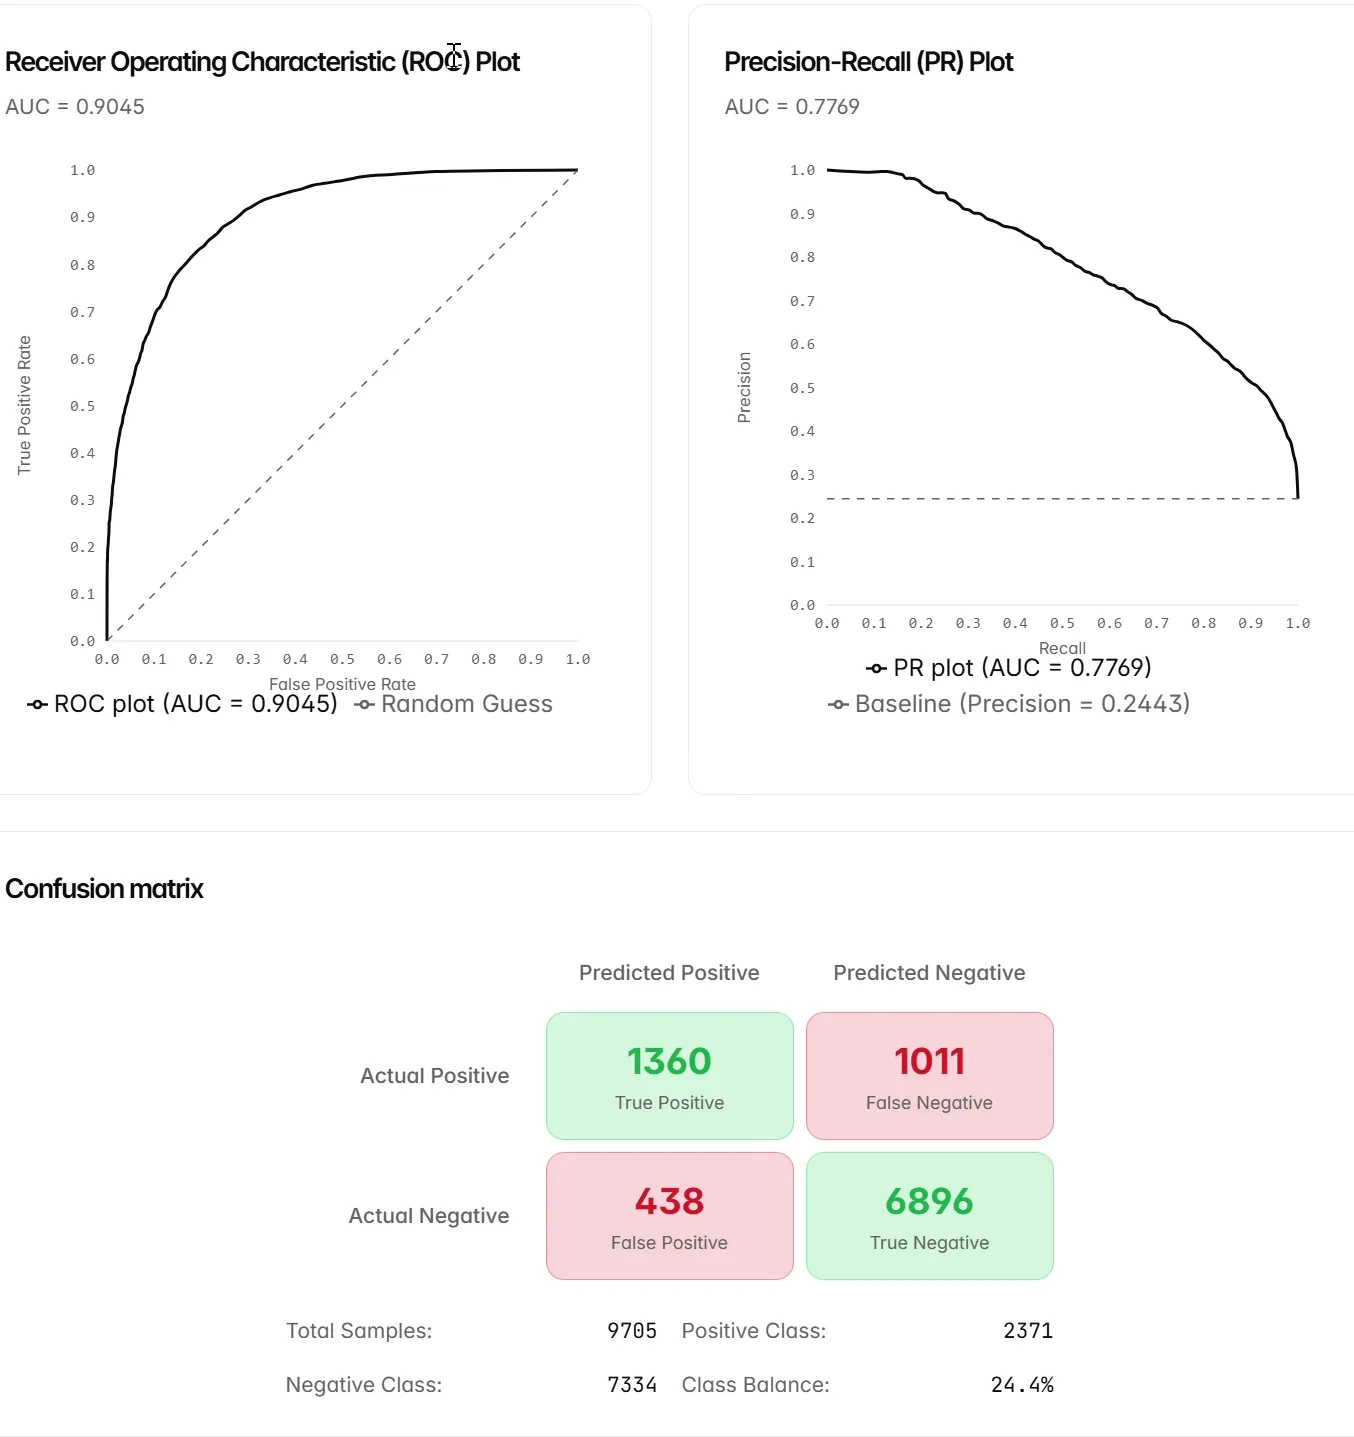
The Receiver Operating Characteristic (ROC) Plot displays True Positive Rate against False Positive Rate. The Precision Recall (PR) Plot displays Precision against Recall. Both show AUC values and a reference baseline in the example. Read them alongside class balance and the consequences of classification errors.
The confusion matrix labels actual classes by row and predicted classes by column. Read the labels before interpreting the counts.
Read the example plots
Read the actual and predicted class labels when interpreting the matrix. These results belong to the adult income evaluation example.
The example reports Class Balance as 24.4%. Use the class counts, evaluation population and task requirements together when assessing performance. Choose an acceptable decision threshold for your use case and compare the resulting false-positive and false-negative counts.
Interpret classification metrics
The threshold changes how probabilities become class decisions. Raising or lowering it changes the confusion matrix and threshold-dependent metrics. Decision threshold step size controls which threshold results are calculated; Decision threshold selects a returned result to inspect.
Interpret regression metrics
Regression results use numeric prediction errors rather than a classification threshold.
Review aggregate error together with the task’s acceptable error range. A good average does not show whether important subgroups or extreme values are poorly predicted.
Next steps
Continue to Explanation views.