

Dependency graph
Generate a dependency graph for a record to follow the displayed computation from inputs through modules to the model output. Use the same model and feature values when comparing it with a local explanation.
Before you begin
Have a running deployment and a record matching its input schema. If you are comparing a graph with a local query, retain exactly the same deployment and feature values.
Generate a dependency graph
-
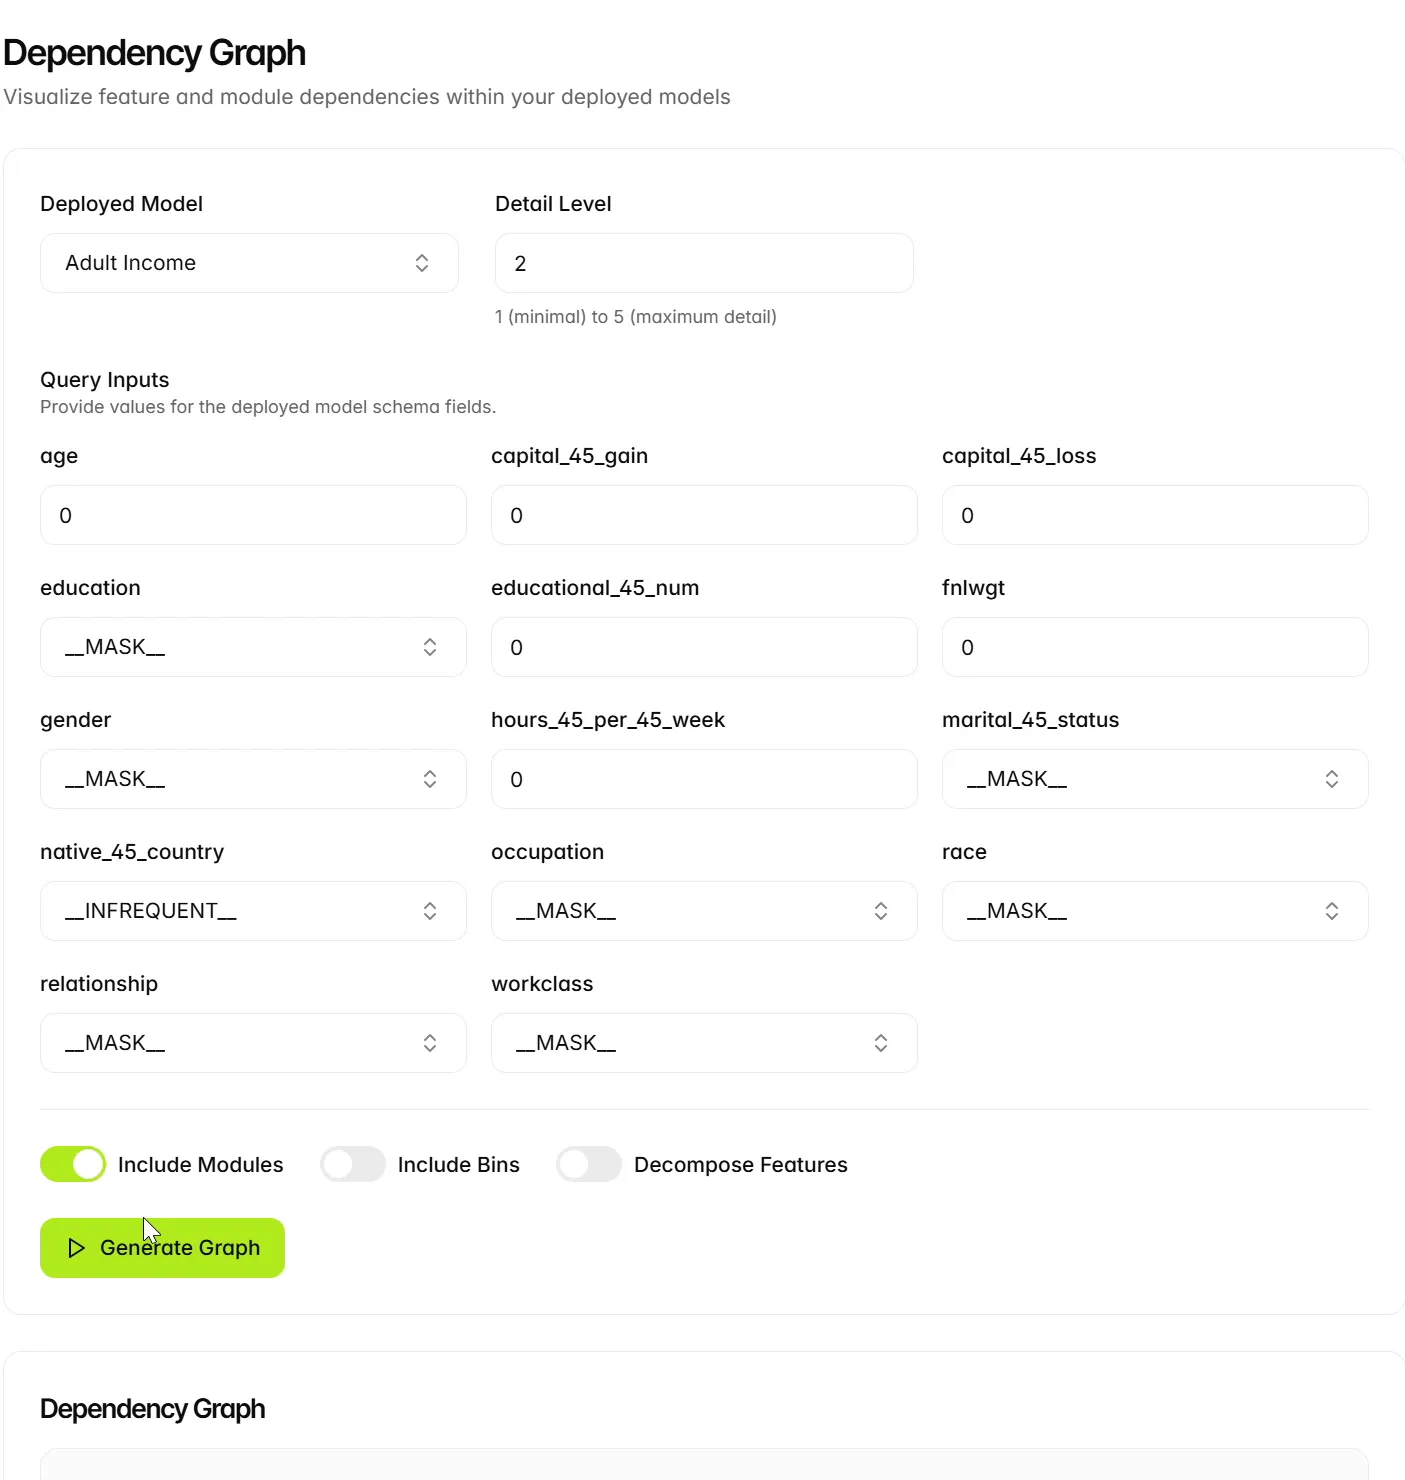
Open Explanation Lab > Dependency Graph and select the intended deployed model.
-
Enter the feature values for the record you want to inspect.
-
Review Detail Level, Include Modules, Include Bins and Decompose Features. The example enables Include Modules and leaves Include Bins and Decompose Features off.
-
Select Generate Graph.
-
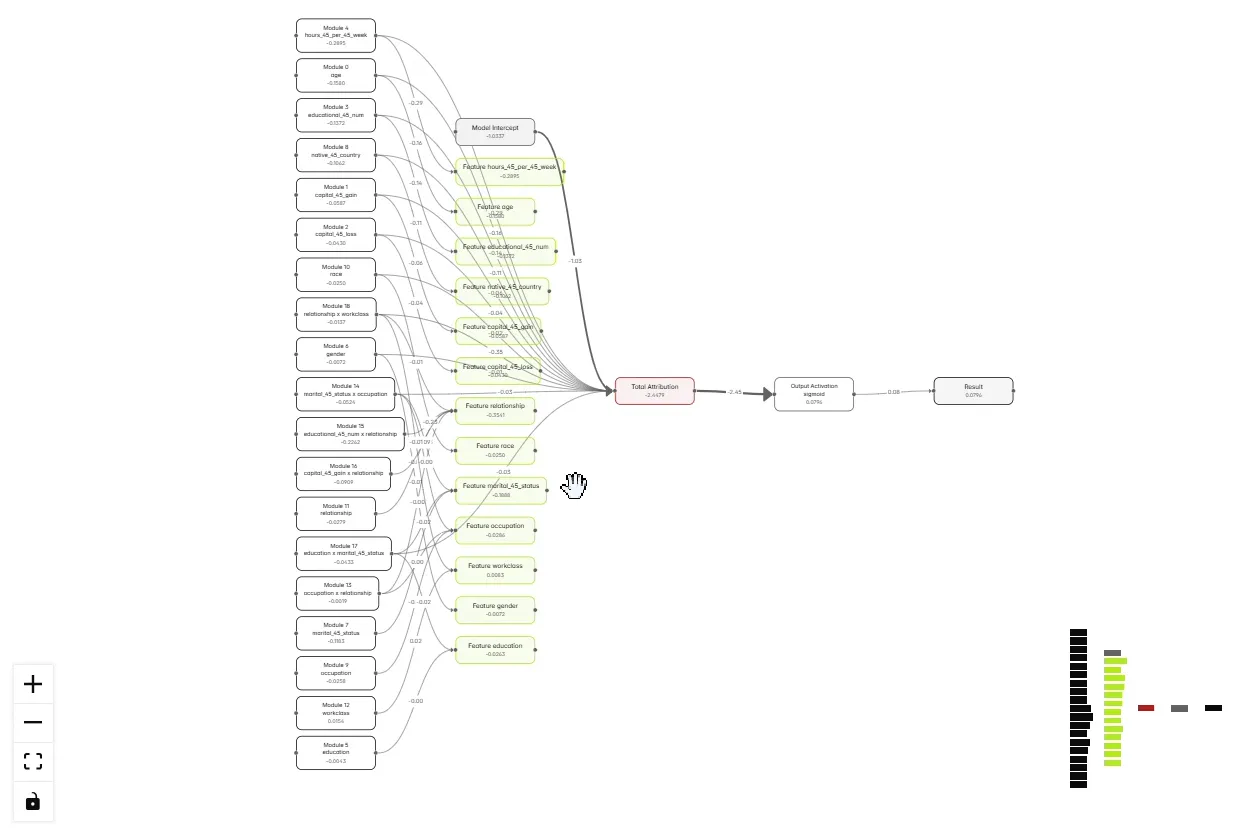
Inspect the nodes, connecting edges and displayed values. Select a node to view its details, and use the graph’s zoom controls and minimap to navigate.
Interpret the graph
The generated graph shows feature and module nodes, total attribution, model intercept, output activation, and result. The legend distinguishes Feature, Module, Bin, Output, and Dependency.
In this example the displayed Output Activation is sigmoid. The result is approximately 0.0796, matching the local query shown earlier. The graph also displays total attribution of approximately -2.4479 and model intercept of approximately -1.0337.
Use the graph to follow the computation represented on the screen. Treat it as a model dependency view; connecting edges are not proof of causality in the underlying business process.
Consistency check: use the same model and feature values when comparing a graph with a local explanation. Otherwise you may be comparing different decisions.
Choose graph options
Change one display option at a time and regenerate the graph to inspect the additional detail. A denser graph may show more of the computation while making the overall path harder to read.
Next steps
Continue to XNN-assisted LLM explanations.