

Module dependencies
Use module dependency plots to inspect how a selected module contributes across feature values. Start in Explanation Lab > Global Explanations with the intended deployed model selected.
Before you begin
Select a running deployment and identify a module to investigate. Use Model structure and decision rules to check which feature or interaction the module represents.
Inspect module dependencies
-
In Global Explanations, select Module Dependencies.
-
Choose a module using Select Module.
-
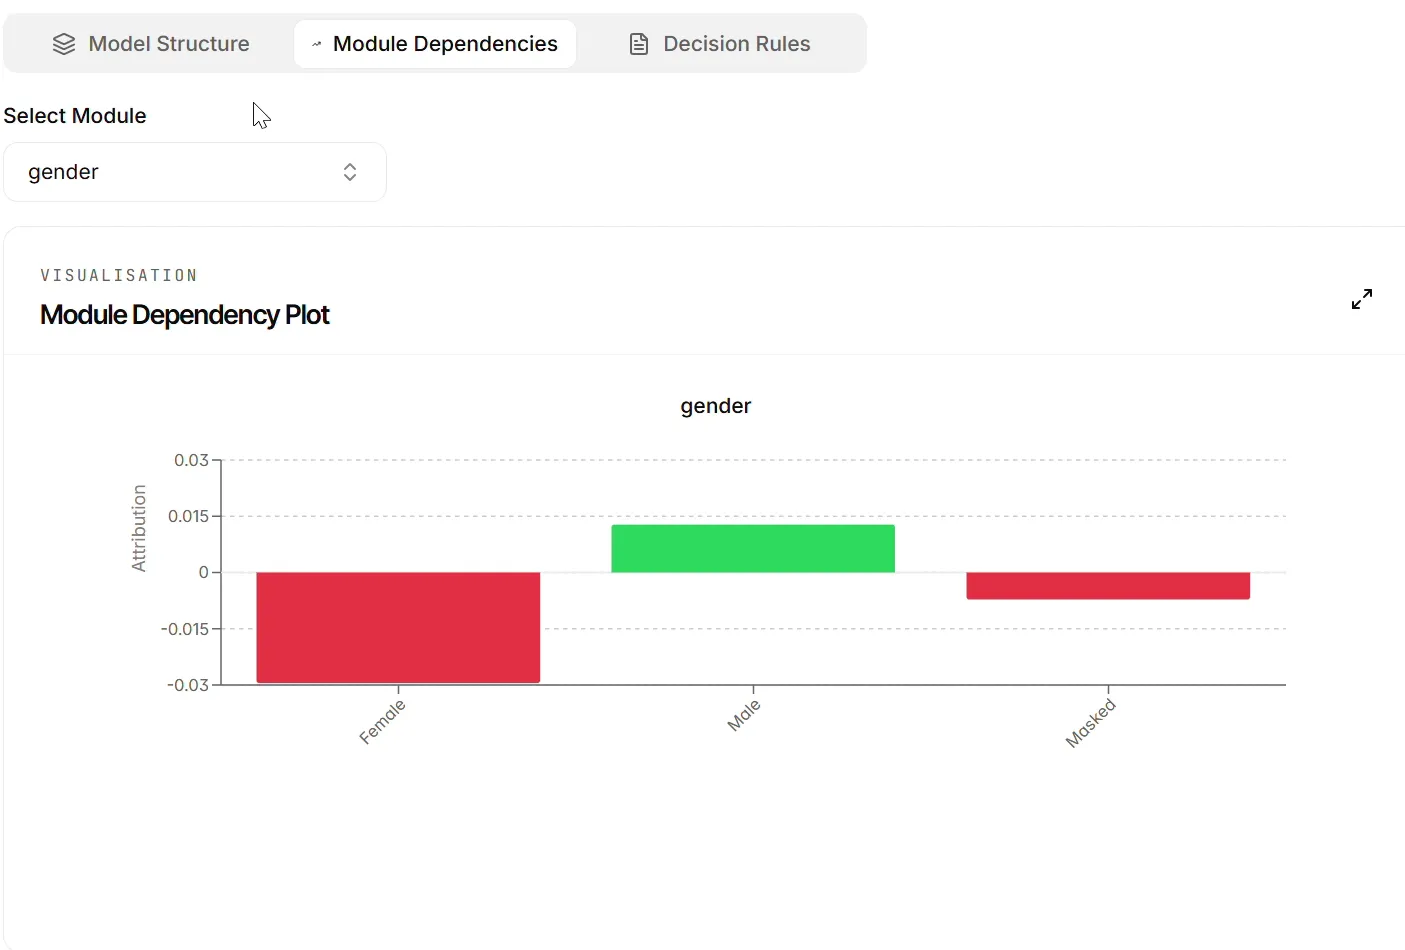
Read the Module Dependency Plot, including its axis labels and categories.
-
Compare the pattern with the corresponding decision rules.
Interpret the plot
For the gender module, the example plot shows Female, Male and Masked categories against attribution. Female and Masked have negative contributions, while Male has a positive contribution in this model.
This is a useful starting point for investigating how the model treats a feature. It is not, by itself, a fairness assessment. Review the broader model, relevant population, evaluation data, and decision context before drawing conclusions.
Use Module Explorer
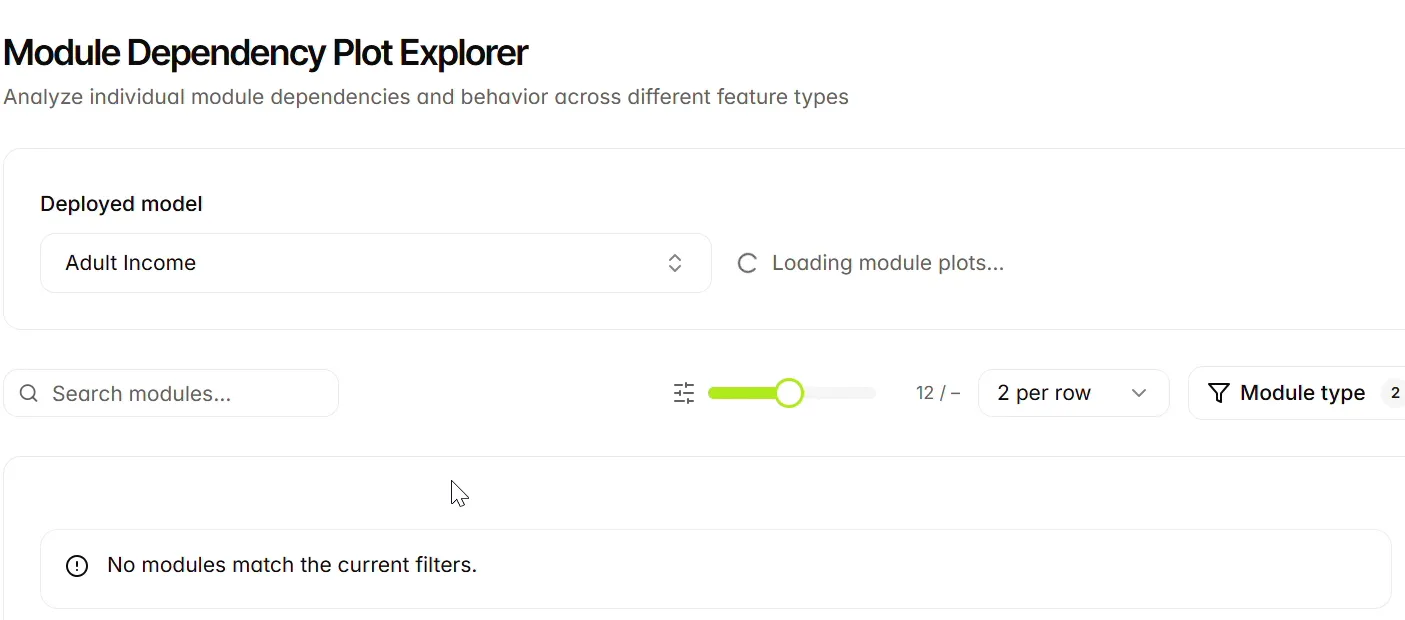
To open the broader plot view, select Module Explorer in the navigation. The page title is Module Dependency Plot Explorer.
In Module Explorer, select the deployed model and use the search field and module-type controls to choose which plots to display. Select 1 per row, 2 per row or 3 per row to change the layout. Expand a plot to inspect it in more detail.
If the explorer displays a loading or no-match message, check the selected model, clear the search or filters as needed and wait for loading to finish. An empty filtered view does not establish that the model has no modules. The screenshot below shows the loading and filter messages to help identify this state.
Compare the plot with the module’s rule conditions and the observed feature range. Categorical axes represent distinct labels; their positions do not establish an ordered or continuous relationship. For interaction modules, interpret the displayed features together.
Next steps
Continue to Dependency graph.